Jupyter Notebooks for SQL Analysis
This is a guest post by Nok Lam Chan
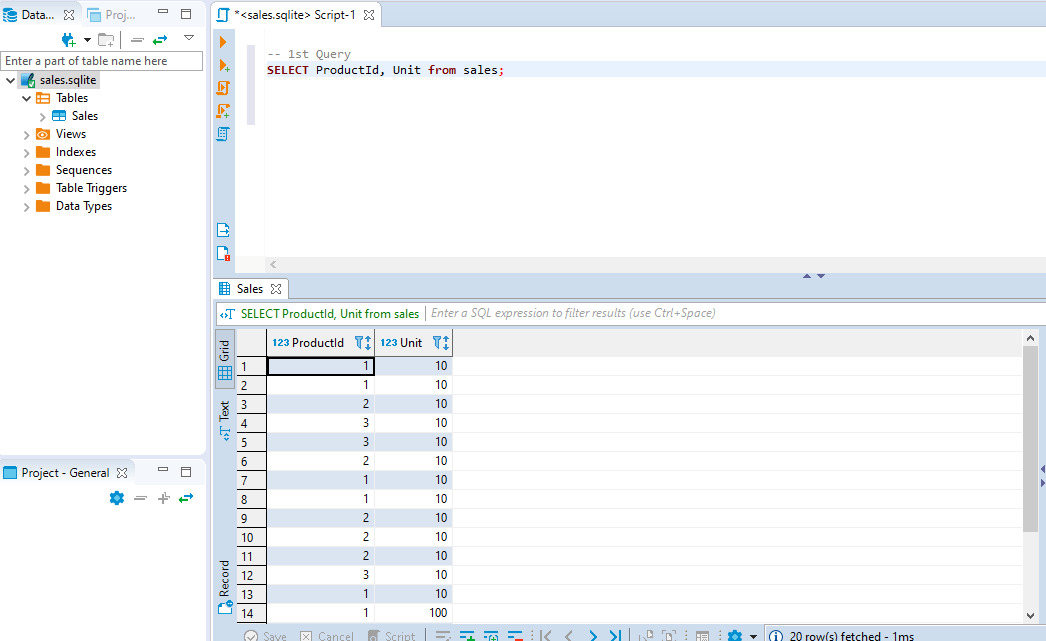
If you’ve ever written SQL queries to extract data from a database, chances are you are familiar with a SQL IDE like the screenshot below. The IDE offers features like auto-completion, output visualization, table schema and the ER diagram. SQL IDE is the go-to tool for most analysts but it has some limitations,
- To do any advanced analysis, we need to extract the data to a CSV file & then process it in Excel or with a programming language like python
- There’s no visualization (plots, graphs) available inside a SQL IDE
- It’s hard to reproduce the same analysis with updated data unless all the steps are documented somewhere
To overcome these limitations, you may want to add Jupyter Notebook into your toolkit. Notebooks improve my productivity by complementing some missing features in a SQL IDE.

How to run SQL queries in Jupyter Notebook
- This is how you connect to SQL DB from Jupyter Notebook using
%sqlmagic,
# !pip install ipython_sql
%load_ext sql
%config SqlMagic.displaycon = False
%config SqlMagic.feedback = False
%sql sqlite:///sales.sqlite.db
- This is how you run a typical SQL query from Jupyter Notebook,
%%sql
select ProductId, Sum(Unit) from Sales group by ProductId;
| ProductId | Sum(Unit) |
|---|---|
| 1 | 1 |
| 2 | 50 |
| 3 | 30 |
Notebook as a self-contained report
As a data scientist, you write SQL queries for ad-hoc analysis all the time. Unlike a well-defined ETL job, you are exploring the data and testing your hypotheses all the time. Sometimes you get the right results but don’t remember the exact SQL query used to fetch initial data & all the intermediate steps taken to clean it up. This is where Jupyter Notebooks shine. You can keep the entire analysis in a single notebook which is easy to review, present & reproduce.
I have seen many screenshots, fragmented scripts, reports flying around in organizations. To reproduce any result, we need to know exactly how the data was extracted & what kind of assumptions have been made. Unfortunately, this information usually is not available. As a result, people are redoing the same analysis over and over. You will be surprised that this is very common in organizations. In fact, results often do not align because every department has its own definition for a given metric. Written definitions are not shared inside the organization & verbal communication is inaccurate and error-prone. It would be fantastic if anyone in the organization can reproduce the same result with just a single click. Jupyter Notebook can achieve that reproducibility and keep your entire analysis (documentation, data, and code) in the same place.
Notebook as an extension of IDE
Writing SQL queries in a notebook gives you extra flexibility of a full programming language alongside SQL. For example, you can
- Write complex processing logic that is not easy in pure SQL
- Create visualizations directly from SQL results without exporting to an intermediate CSV
For instance, you can pipe your SQL query with pandas and then make a plot. It allows you to generate analysis with richer content. If you find bugs in your code, you can modify the code and re-run the analysis. In contrast, if your analysis is reading data from an anonymous exported CSV, it is almost guaranteed that the definition of the data will be lost. No one will be able to reproduce the dataset after 6 months.
You can make use of the ipython_sql library to make queries in a notebook. To do this, you need to use the magic function with the inline magic % or cell magic %%.
sales = %sql SELECT * from sales LIMIT 3
sales
| ProductId | Unit | IsDeleted |
|---|---|---|
| 1 | 10 | 1 |
| 1 | 10 | 1 |
| 2 | 10 | 0 |
To make it fancier, you can even parameterize your query with variables. Tools like papermill allows you to parameterize your notebook. If you execute the notebook regularly with a scheduler, you can get an updated dashboard. To reference the python variable, the $ sign is used.
table = "sales"
query = f"SELECT * from {table} LIMIT 3"
sales = %sql $query
sales
| ProductId | Unit | IsDeleted |
|---|---|---|
| 1 | 10 | 1 |
| 1 | 10 | 1 |
| 2 | 10 | 0 |
With a little bit of python code, you can make a nice plot to summarize your findings. You can even make an interactive plot if you want. This is a very powerful way to extend your analysis.
import seaborn as sns
sales = %sql SELECT * FROM SALES
sales_df = sales.DataFrame()
sales_df = sales_df.groupby('ProductId', as_index=False).sum()
ax = sns.barplot(x='ProductId', y='Unit', data=sales_df)
ax.set_title('Sales by ProductId');

Notebook as a collaboration tool
Jupyter Notebook is flexible and fits extremely well with exploratory data analysis. You can easily share notebooks with non-technical stakeholders as well. Notebooks have an infamous reputation that they’re difficult to version control or to collaborate with. Luckily, there are efforts that make collaboration in Jupyter Notebooks a lot easier now.
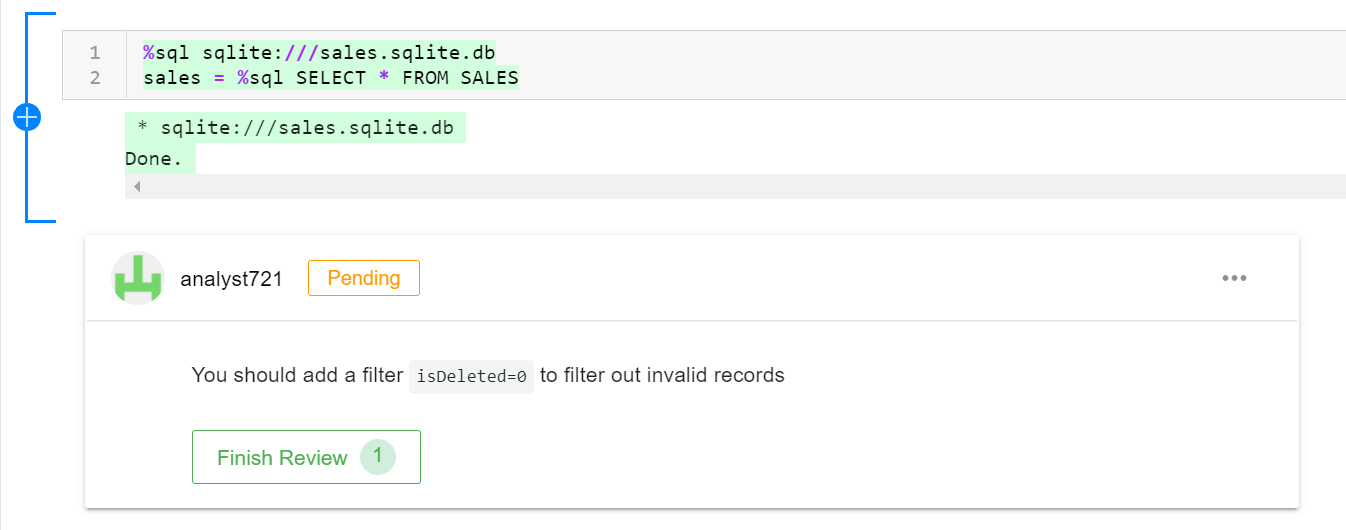
With ReviewNB, you can publish your result and invite a teammate to review your analysis. They can share their feedback directly on the Jupyter Notebook cells. This kind of workflow is not possible with just the SQL script or a screenshot of your finding. Jupyter notebooks act as documentation, presentation and collaboration tool for your analysis.
Step 1 - Review PR online

Anyone can view the notebook and add comments on a particular notebook cell via ReviewNB. This lowers the technical barrier as your analysts do not have to understand Git. They can review changes and make comments on the web without the need to pull code at all. As soon as your teammate makes a suggestion, you get an email notification & can act on it.
Step 2 - Review Changes

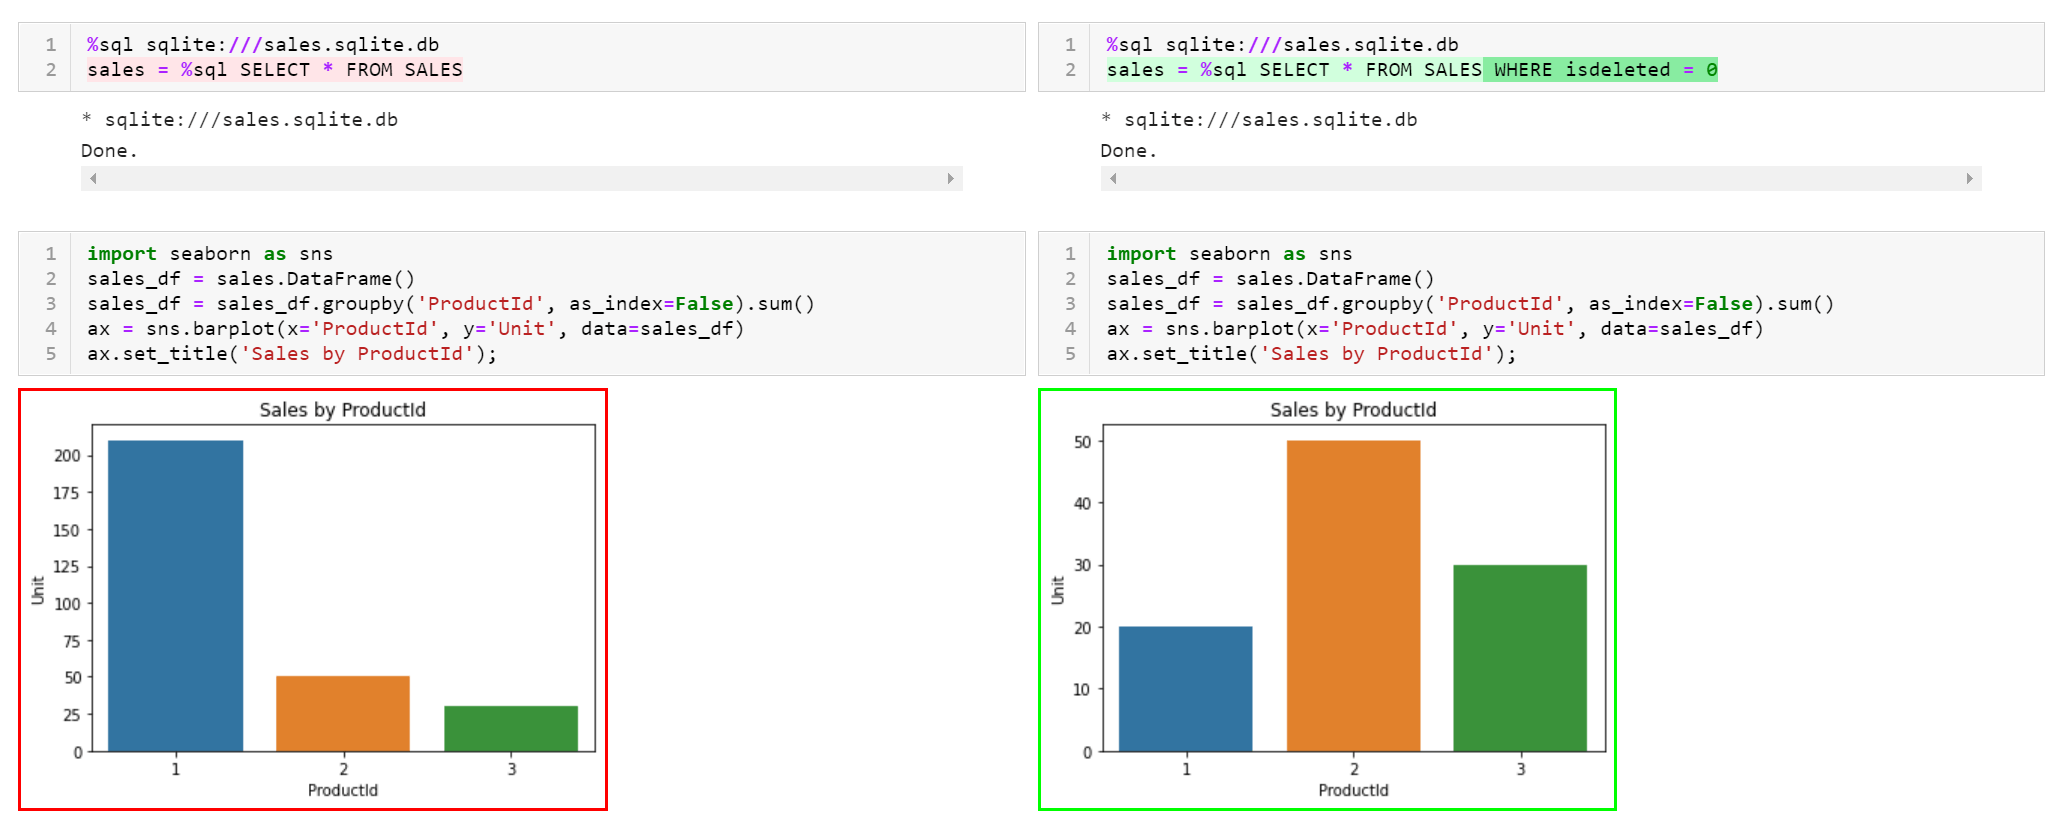
Once you have made changes to the notebook, you can review the diff side by side. Notebook diffs on GitHub are typically very noisy but ReviewNB shows human readable rich diffs for Notebooks as shown above.
Step 3 - Resolve Discussion

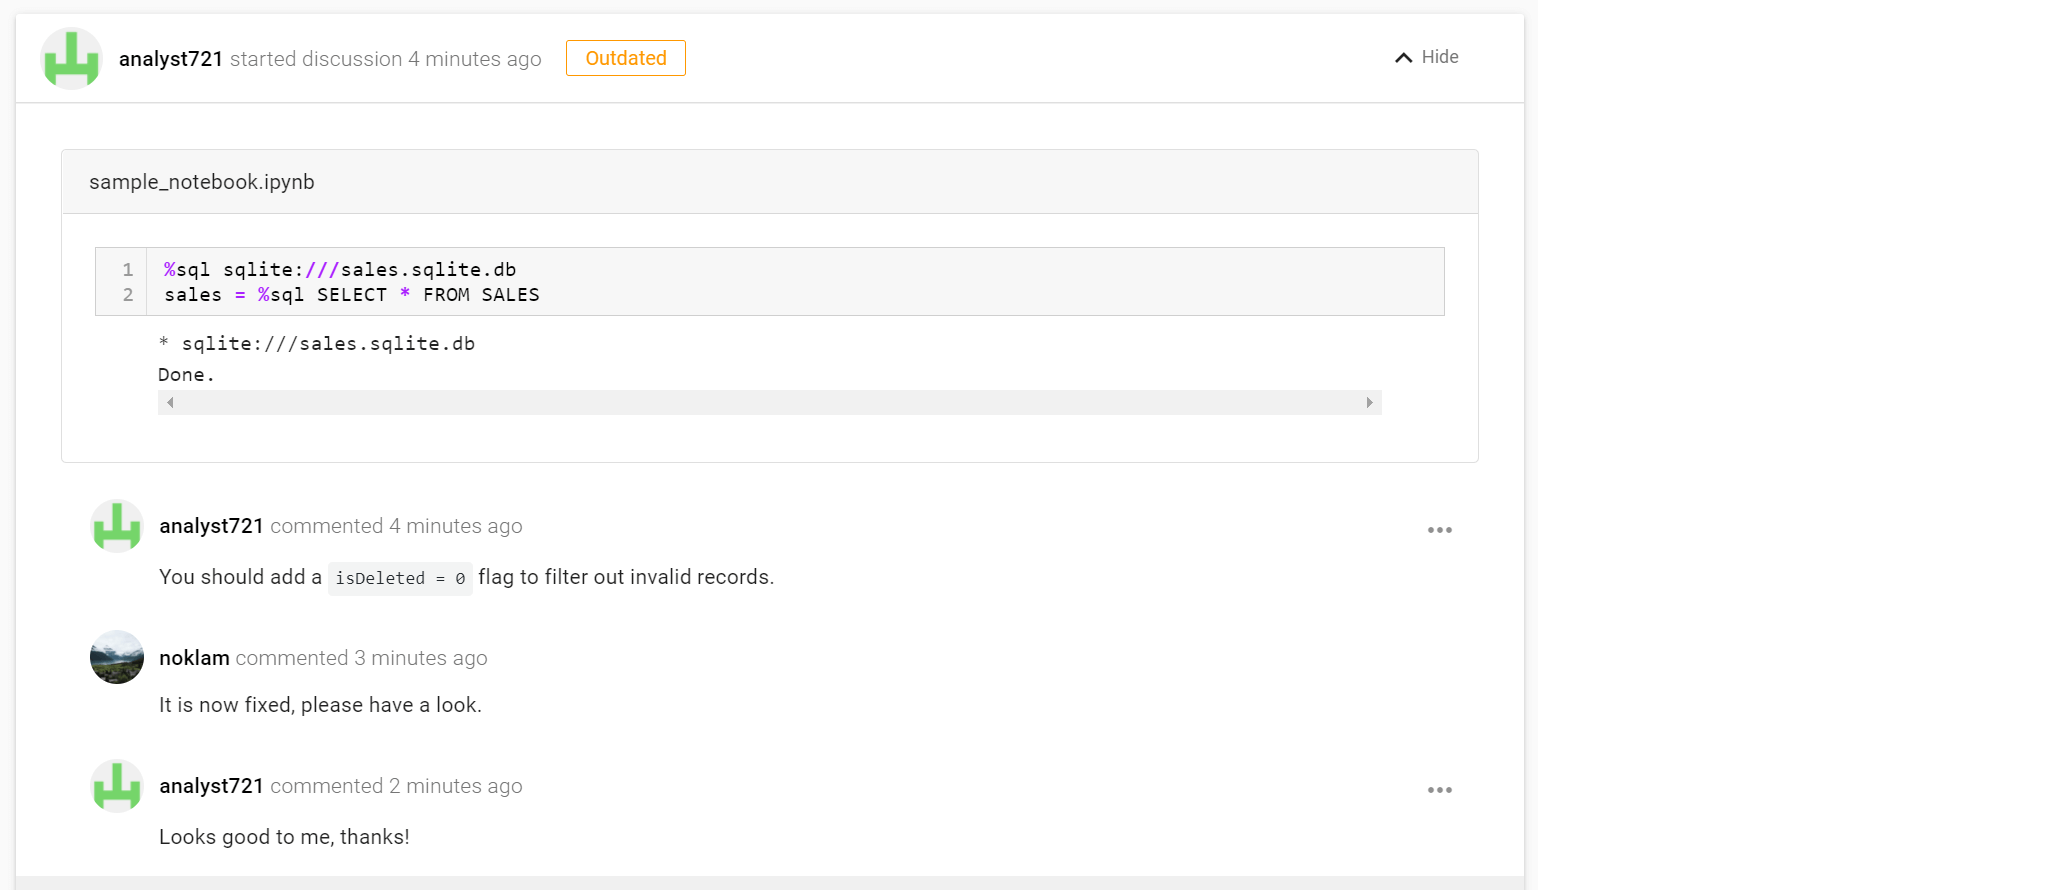
Once the changes are reviewed, you can resolve the discussion and share your insight with the team. You can even publish the notebook to an internal sharing platform like knowledge-repo for wider consumption.
I hope this convinces you that Jupyter Notebook is a good choice for ad-hoc analysis. It is possible to collaborate with Jupyter Notebooks via ReviewNB. Whether you use Jupyter or not, you should document the process to make it easier for others (or future you) to reproduce the results!
