Plotting with Pandas in Jupyter
The two most important tools that help us make sense of data and draw insights are,
- Visualizations
- Statistical analysis
In this blog, we’ll talk about tips & tricks to help you plot better in a Jupyter Notebook. By the end, you’ll learn -
- How to plot a pandas dataframe in Jupyter
- How to update existing plots with the notebook backend
- How to make plots interactive with
mpld3
Plotting with Pandas
Anyone who has worked with data and python must be familiar with matplotlib and the pyplot interface. It helps you generate all the basic charts and graphs with just a couple of lines of code. But did you know that pandas, one of the most used python library, has an in-built implementation of matplotlib.
Pandas can plot everything with it’s in-built plot function. You just need to select the type of plot and provide the dataframe for it.
For example let’s use this simple dataframe of Iris Data -
import pandas as pd

iris = pd.read_csv("iris.csv")
iris.head(5)
| sepal_length | sepal_width | petal_length | petal_width | species | |
|---|---|---|---|---|---|
| 0 | 5.1 | 3.5 | 1.4 | 0.2 | setosa |
| 1 | 4.9 | 3.0 | 1.4 | 0.2 | setosa |
| 2 | 4.7 | 3.2 | 1.3 | 0.2 | setosa |
| 3 | 4.6 | 3.1 | 1.5 | 0.2 | setosa |
| 4 | 5.0 | 3.6 | 1.4 | 0.2 | setosa |
Now, if we want a quick analysis of the petal length and we want to see a distribution we can simply chose to do a plot on the petal_length using the pandas plot function and specify the kind argument as hist for a histogram-
iris.petal_length.plot(kind = 'hist')

Or if we want to plot a scatter plot between petal length and petal width, we can simply specify the x & y variables and the kind as scatter and watch it work
iris.plot('petal_length', 'petal_width', kind = 'scatter')

Basically, all you have to do is choose the column/series that you want to plot, then choose a kind of plot you want from the list
This gives you a quick means to analyze your pandas dataframe without having to worry about a separate visualization library. And while it seems too simplistic, it still provides you with all the parameters to format your charts the way you want them.
Incrementally update plots in Jupyter
You’ll likely know about the inline magic function,
%matplotlib inline
This enforces the plot to be rendered within the browser like code output. The drawback with the inline backend is that you can’t change an existing plot without re-rendering it. Say you want to add a title or x-axis label to an existing plot, that’s not possible. You will have to generate a new plot and add the code for title and x-label before calling the show function. Lets see with the help of an example -
%matplotlib inline
import matplotlib.pyplot as plt
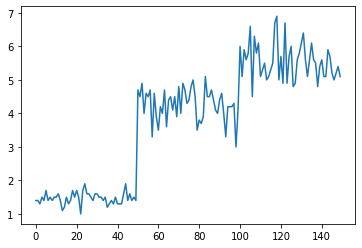
plt.plot(iris.petal_length)
plt.show()
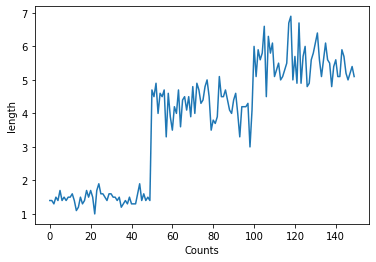
to add the axes labels we will have to generate the plot again which can be frustrating
plt.plot(iris.petal_length)
plt.xlabel("Counts")
plt.ylabel("length")
plt.show()
To overcome this you can use the notebook backend instead of the inline backend.
%matplotlib notebook
The notebook backend enables the plot function to check if an active figure exists and if it does, it will executes the command against the active figure. That way you don’t have to generate the whole plot again, you can simply update the existing plot. Here’s an example -
%matplotlib notebook
import matplotlib.pyplot as plt

plt.plot(iris.petal_length)
plt.show()
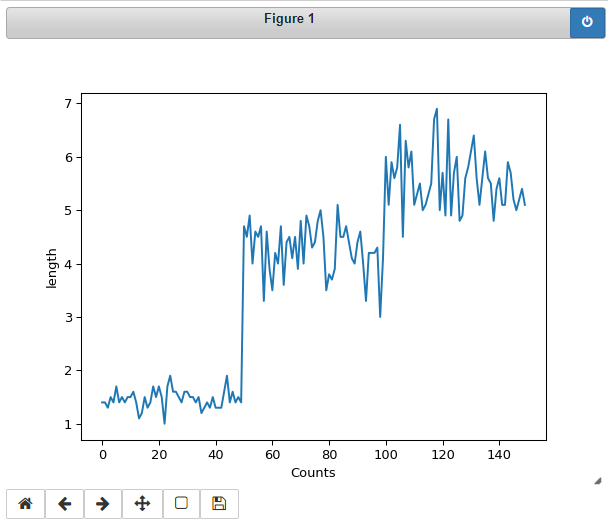
Here even though we forgot to add the labels in the first go, we do not need to worry as we can add the labels as long as the plot is active. You will notice that the plot has a strip on it which has a ‘power’ button. It means this is an active window and all subsequent plot functions are executed on the active window.
So now when I will execute the below lines they will alter the above plot,
plt.xlabel("Counts")
plt.ylabel("length")
When I execute the above lines, I didn’t have to generate the plot again but the system adds the labels to the active plot itself. Isn’t that cool!
Make interactive plots with mpld3
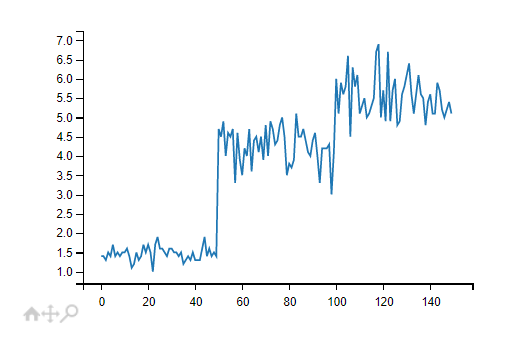
Basic plots generated with pandas are not interactive e.g. they do not have magnification and movement features on the plot. The mpld3 package comes to the rescue -
%matplotlib inline
import mpld3
mpld3.enable_notebook()
Now your plot will have the Magnification and Movement features -
plt.plot(iris.petal_length)
plt.show()
Quick Recap
In this blog you learned,
- How to plot a pandas dataframe in Jupyter
- How to update existing plots with the notebook backend
- How to make plots interactive with
mpld3
If you enjoyed this article and you use Jupyter Notebooks for your visualization, you might like to checkout ReviewNB. It helps you version control Jupyter Notebooks on GitHub & collaborate within your team.