Sharing interactive dashboards with ipywidgets & ReviewNB
If you’ve created interactions in your Jupyter Notebook, you might have heard about IPython widgets. In this post, we talk about how you can create interactive dashboards with ipywidgets and how to share those with your team.
What are ipywidgets?
ipywidgets are Interactive HTML widgets inside Jupyter notebooks.
These allow us to create interaction in our notebooks often with just a few lines of code. These widgets are particularly handy in data exploration and analysis. Widgets help you convert your Jupyter Notebooks into an interactive dashboard instead of plain static documents.
Widgets can make your notebooks look more lively and fun. To put it simply, widgets are elements like buttons, drop-down lists, sliders, etc. With widgets, you can manipulate the output according to the selected parameters e.g. filter rows based on a criteria.
Installing ipywidgets
You can easily install the latest version of ipywidgets with pip or conda.
If you have the latest version of Jupyter Notebook, installing ipywidgets will also automatically configure your Jupyter to use widgets. This happens with the help of the widgetsnbextension package. This package configures the Notebook to display and use widgets.
If you have an older version of Jupyter Notebook , then you might have to manually enable the ipywidgets notebook extension as shown below -
jupyter nbextension enable --py widgetsnbextension
Your first Widget
Here is a very simple example of a widget. You can create a slider interaction with just these two lines of code.
Interacting with Widgets
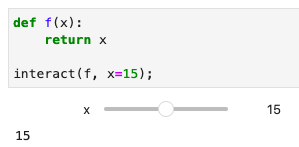
The widget.IntSlider() function only displays the slider. Let’s see how we can interact with it. The interact function present in the ipywidgets helps us interact with our widget. This function creates a user interface using which we can explore and interact with our data.
ipywidgets.interact() automatically generates UI controls for function arguments. It calls the registered function (f() in the following example) with the new argument (x below) whenever we manipulate the controls interactively -
Widgets Events
When you manipulate a widget, a message is returned from the interaction. The message from the window system is called a widget event. Usually, when this message is received by the widget program, an action is performed. Examples of actions could be opening a file, creating a graph, etc.
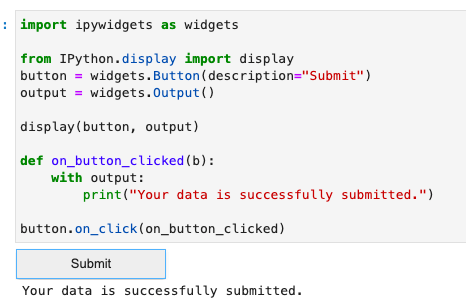
Here’s an example of the button widget. When the button is clicked, the on_button_clicked method is executed as it’s registered via the on_click event.
Note that the button clicks are stateless. The message is sent from the front end to the back end once the button is pressed. You can use the output widget to print the message. Here’s how it looks -
Widget Examples
Dataframe filtering with ipywidgets
Let’s look at a little more complex interaction. First, create a dataframe with your choice of data. Here I’m using medium article statistics data. With just a slider and drop-down widget, you can easily play around with your dataframe as shown below.
Check out the demo here
Column correlation with ipywidgets
Let’s have look at more examples of widgets to analyze and explore data. This widget can help you find correlations between columns. The corr function computes the pairwise correlation of columns, excluding the NA/null values. Note that correlation of a variable with itself is 1.
Check out the demo here
Scatterplot with ipywidgets & plotly
Now let’s see how you can create interactive plots using ipywidgets & Plotly. Here I have called the plot with iplot function which automatically generates an interactive version of the plot inside the Notebook. Here I have used selection widget. A list can be passed as values to the selection widget. You can specify the enum of the selectable options by passing a list. The options can be either (label, value) pairs, or simply values for which the labels are derived by calling str).
Check out the demo here
Heatmaps with ipywidgets & plotly
Here is another powerful example to create heatmap and explore your data. A heatmap is slightly more interesting way to represent data. Data values are represented as colors in heatmap. Heatmap uses color in order to represent a value. This is a great tool to assist when you have a large volume of data.
Check out the demo here
Sharing interactive dashboards with your team using ReviewNB
ReviewNB is a remarkable tool to help your team collaborate on Jupyter notebooks.
Notebooks are flexible and effective with data analysis. With the power of widgets, you can easily share your work with your team. Traditionally, notebooks were not that good when it came to version control & collaboration. But ReviewNB helps overcome these shortcomings. Here’s what it can do -
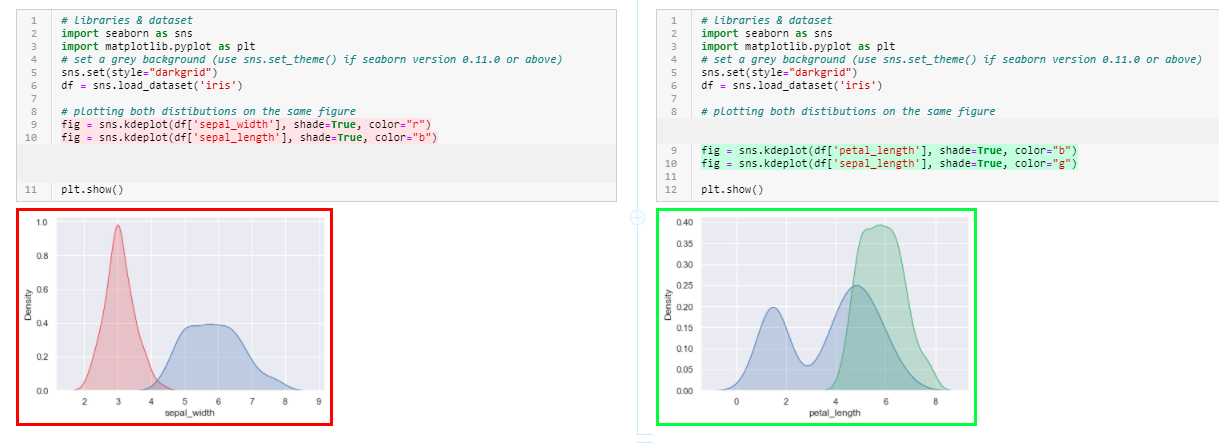
Rich Diff
You can review and verify diffs side-by-side easily. GitHub diffs are not very visually appealing but with ReviewNB you can check out diffs in a more human-readable format.
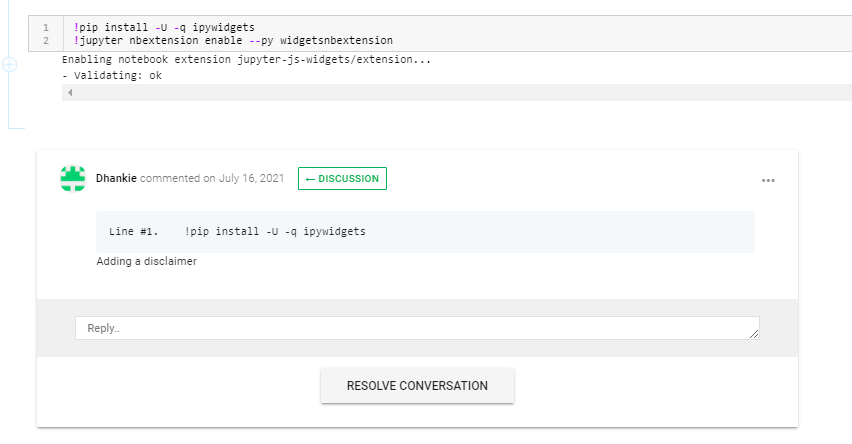
Cell comments
You can initiate discussions on any notebook cell within ReviewNB. This helps avoid any confusion while discussing with your teammates. You don’t have to keep track of which comment corresponds to which cell. ReviewNB allows you to do that with this sleek feature.
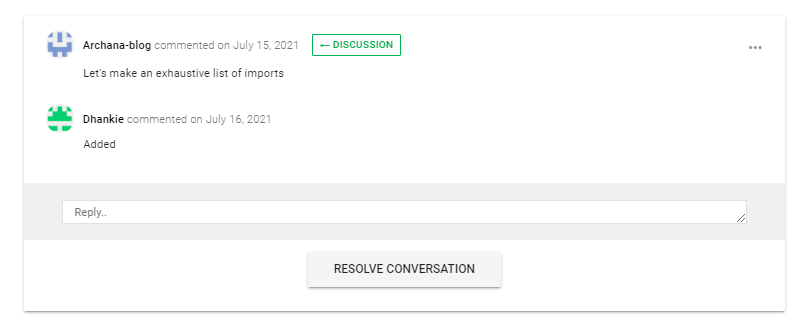
Resolving open threads and conversations
Once you have addressed the changes, you can resolve conversations to keep the discussion organized.
Summary
We learnt how to use ipywidgets to create complex interactions in Jupyter notebooks. We saw how ReviewNB can help us share these interactive notebook dashboards with the team & receive their feedback. I hope you you found it helpful. Happy Hacking!